Most Shopify and WooCommerce sellers set prices one of three ways: they look at what competitors charge, they apply a standard markup to their cost, or they guess based on what feels right. All three approaches produce prices that might work. None of them produce prices that are actually optimized for their specific store, their specific customers, and their specific products.
The data that could answer the real question — what price will earn us the most profit on this product, with this customer base — already lives inside the store. It's in every order placed, every sale completed, and every time a price changed and volume went up or down in response. The problem is that most sellers never extract a useful signal from it.
Why the Standard Pricing Methods Fall Short
Competitor-based pricing
Looking at what competitors charge is a reasonable starting point when you have no other information. It is a poor permanent strategy for two reasons.
First, your competitor's price reflects their cost structure, their margins, their customer relationships, and their inventory situation — none of which are yours. Matching their price means you're running their pricing strategy, not yours.
Second, competitor pricing is almost always reactive. By the time you've matched a competitor's new price, the market has already moved.
Cost-plus pricing
A standard markup (say, 2.5x cost) is easy to apply and easy to explain. It also ignores everything that matters most: how much customers are willing to pay for this specific product, whether the market price has moved since you set it, and whether the markup that works for one category makes sense for another.
A 2.5x markup on a commodity product in a competitive niche might price you out of the market. The same markup on a differentiated product your customers love might leave significant revenue on the table. The markup tells you nothing about which situation you're in.
Gut feel
Gut feel is fine when you're pricing your first product with zero data. It is a surprisingly stubborn habit once you have a year of sales history that could replace it.
What Price Elasticity Actually Tells You
Price elasticity of demand is the relationship between a price change and the resulting change in sales volume. It tells you, concretely, how sensitive your customers are to price on a specific product.
A product with low elasticity loses relatively little volume when the price goes up. Customers want it regardless of a modest price increase. A product with high elasticity drops sharply in volume when the price rises. Customers will switch to alternatives or simply not buy.
This difference is not obvious without data. Two products sitting side by side in your catalog can have completely different elasticity profiles. Pricing them the same way ignores that difference entirely.
When you know a product's elasticity, pricing decisions become more straightforward:
- Low elasticity: raise the price. Volume holds, margin improves.
- High elasticity: be conservative with increases. Even small price rises hurt volume significantly.
- Moderate elasticity: test incremental changes and measure the response before committing.
The challenge is that calculating elasticity manually requires historical price-change data, statistical modeling, and enough volume for the numbers to be meaningful. That is a data science project most ecommerce teams do not have the capacity to run.
How Sellers Are Extracting This Signal From Existing Data
The data needed to estimate per-product elasticity already exists in most Shopify and WooCommerce stores. Every time a price changed and order volume moved up or down in response, that is a data point. Accumulate enough of them across enough SKUs and a usable demand model emerges.
A few approaches sellers use to extract this signal:
Manual tracking: record every price change and the resulting volume change in a spreadsheet. Slow, error-prone at scale, and requires manual analysis to find patterns. Reasonable for catalogs of five to ten SKUs.
Export and model: pull order history from Shopify and run a regression. Requires data skills but gives you a real elasticity coefficient per SKU. Works if someone on the team is comfortable in Excel or Python and you have enough historical variation in prices.
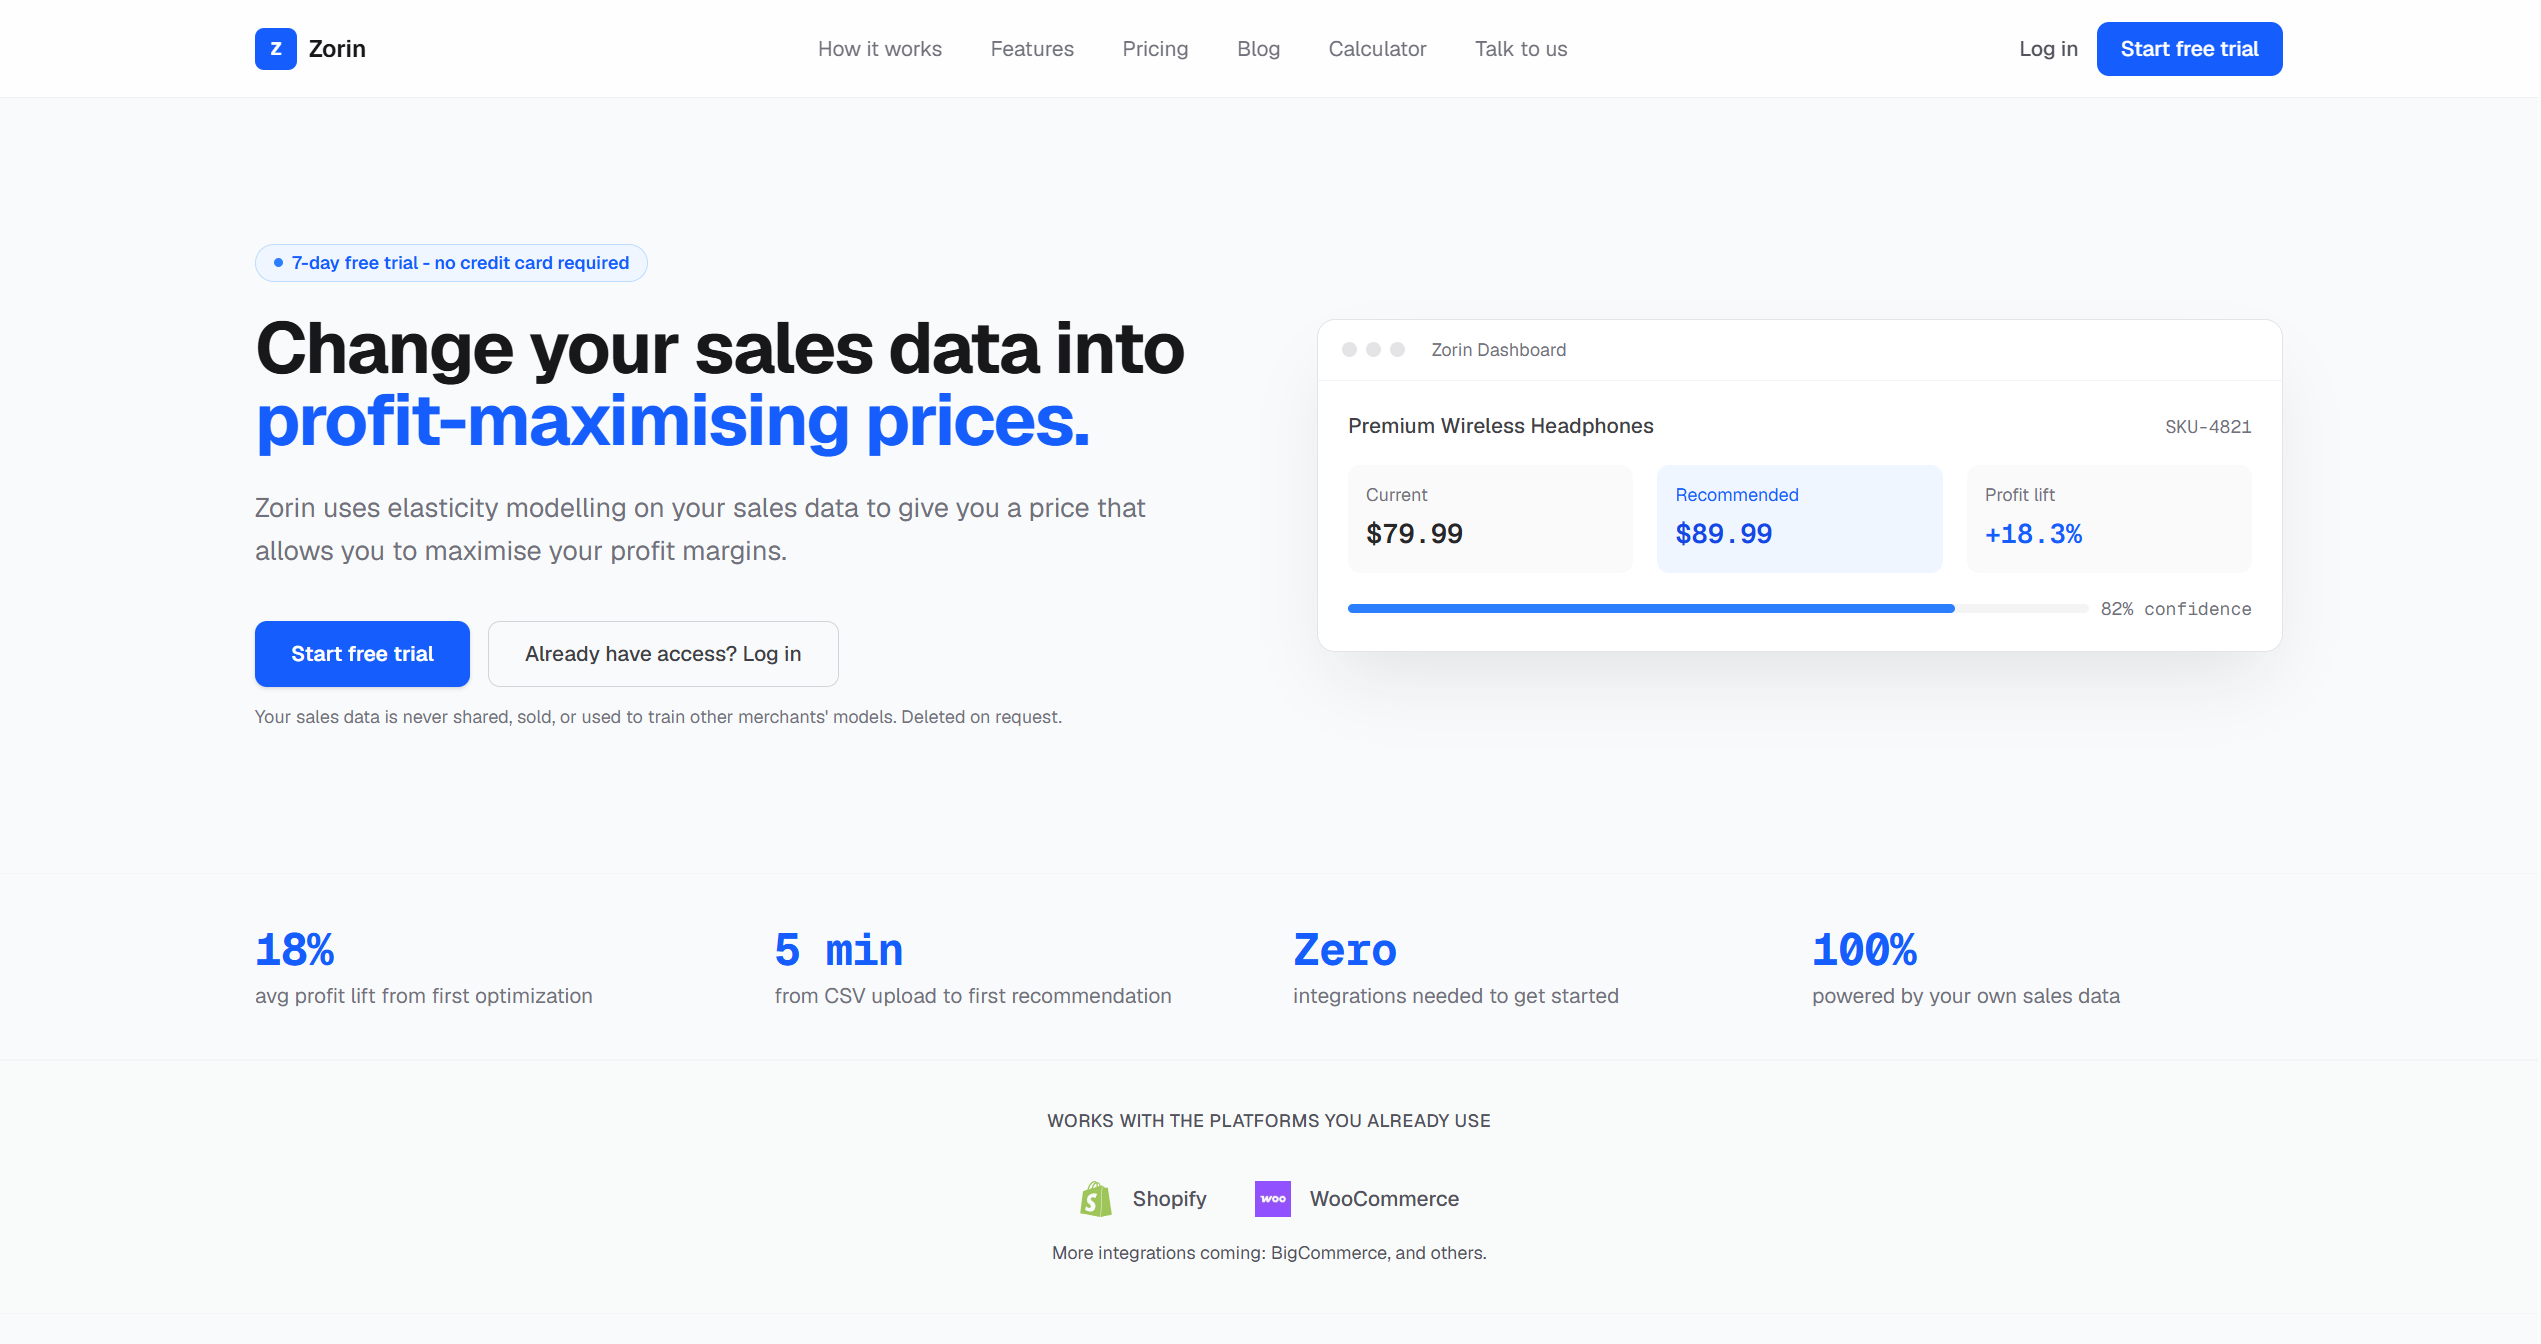
Purpose-built price elasticity software: tools designed specifically to read a store's sales history, fit a demand model per SKU, and return a raise, lower, or hold recommendation with a confidence score and an estimated profit impact. No modeling required on the seller's end — reasonable for mid-size catalogs where manual analysis is not feasible.
The right approach depends on catalog size, available skills, and how often pricing decisions need to be revisited.
The Practical Benefit: Knowing Before You Change
The biggest advantage of elasticity-grounded pricing is not the recommendations themselves. It is knowing the expected outcome before committing to a change.
Without elasticity data, a price increase is a bet. You change the price, wait a few weeks, and try to figure out whether any sales drop was because of the price or because of seasonality, a competitor move, a platform algorithm shift, or some other variable entirely.
With elasticity data, you go in with a hypothesis: this product's demand is inelastic at this price point, so a modest price increase should reduce volume by only a small amount while improving margin enough to make the change net positive. Then you measure against that prediction.
That shift — from reacting after the fact to predicting before the change — is what separates pricing as a guessing game from pricing as a managed process.
Where to Start
If you are starting from scratch with no prior analysis:
- Audit your pricing history: look back at the last 12 to 24 months and identify every SKU where the price changed. Note the date, old price, new price, and volume before and after.
- Start with your top 20 SKUs by revenue: these are the products where a 5 to 10% price improvement has the most dollar impact. Try to calculate a rough elasticity from your historical data for these first.
- Make one change, measure deliberately: pick a product with enough monthly volume to get a meaningful signal, change the price, and track volume for four to six weeks. Compare the result to your hypothesis.
- Systematize from there: once you have done this manually for a handful of SKUs, you will understand what you are looking for and whether a tool can help you do it at scale.
Pricing Is the Lever Most Ecommerce Businesses Under-Optimize
A well-cited McKinsey study found that a 1% improvement in price realization, holding volume constant, translates to roughly an 11% improvement in operating profit — more than a 1% improvement in volume or a 1% reduction in variable costs.
Most ecommerce stores have already optimized their ad spend, their email flows, their checkout conversion, and their fulfillment costs. Pricing, for most of them, is still a gut call made at product launch and rarely revisited with any rigor.
The data to do better is already there. The question is whether you're using it.
About the author: Dexter is part of the team at Zorin, a price elasticity tool for Shopify and WooCommerce sellers that reads a store's own sales history to model per-SKU demand and return raise, lower, or hold pricing recommendations with confidence scores and estimated profit impact. You can learn more at tryzorin.com.